Indices of Deprivation (2019)
What are the indices of deprivation?
The most recent indices of deprivation were published on 26th September 2019.
The indices of deprivation measure relative levels of deprivation in 32,844 small areas or neighbourhoods, called lower super output areas, in England. The indices are used to analyse patterns of deprivation for small areas across the country. Summaries are also provided at county, upper tier local authority and local authority district level.
Overview of key findings - Nottinghamshire
-
Nottinghamshire is ranked 101 out of 151 Upper Tier Local Authorities in England in the overall index, 1 being the most deprived.
-
Nottinghamshire is ranked 9 out of 26 shire Counties in England, 1 being the most deprived.
-
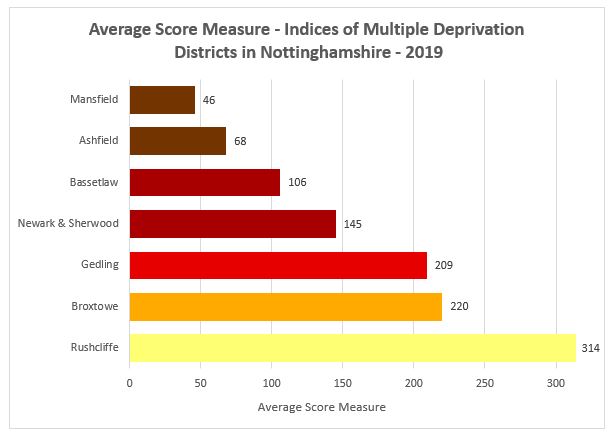
Mansfield is ranked 46 out of 317 Lower Tier Local Authorities (Local Authority District) in England (using an average score measure) which puts Mansfield in the top 20% of most deprived districts in the country.
-
Rushcliffe is within the top 3% of least deprived Local Authority Districts in the Country.
-
Nottinghamshire's overall change in ranking is -2 between 2015 and 2019.
The districts of Nottinghamshire IMD 2019 results
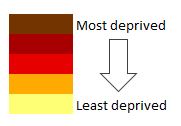
There are 317 districts in England, each district is ranked using an average score measure. (1 being the most deprived and 317 the least deprived). Mansfield is the most deprived of the districts using the average score measure. (46 out of 317 districts). Rushcliffe Borough is the least deprived ranked 314 out of 317 districts in England.
Nottinghamshire lower super output Area IMD 2019 results
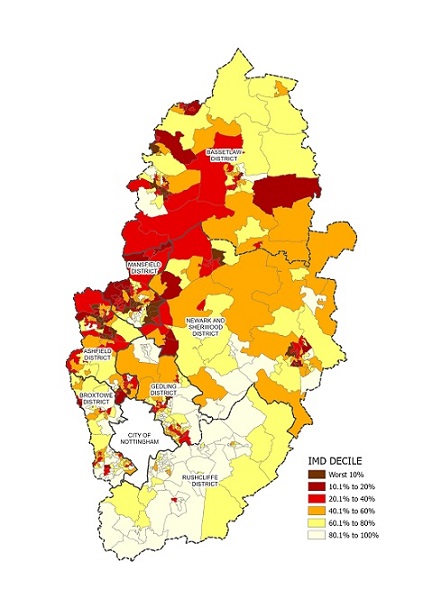
- In Nottinghamshire (excluding Nottingham City) there are 31 LSOAs in the 10% most deprived LSOAs in England, an increase from 25 in 2015.
- The most deprived LSOA’s are concentrated in the districts of Ashfield (12 LSOAs), Mansfield (10), Bassetlaw (5) and Newark & Sherwood (3).
- There are 79 LSOAs in the 20% most deprived LSOAs in England, an increase from 71 in 2015.
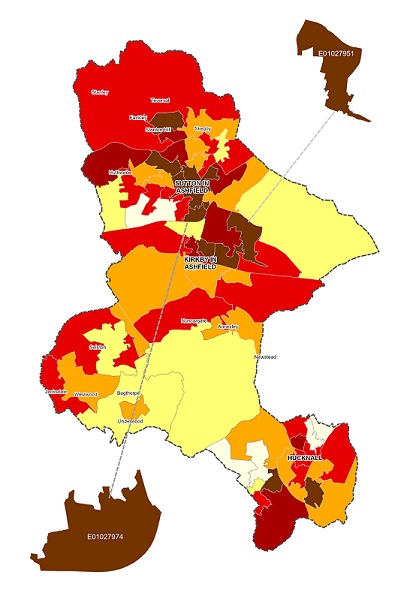
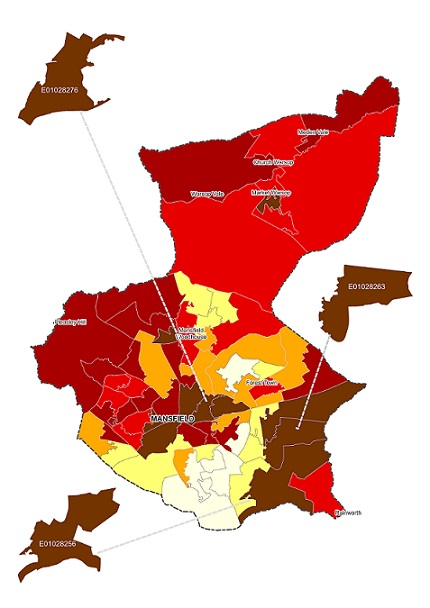
- The maps below give details of the five most deprived LSOAs in Nottinghamshire in Ashfield District and Mansfield District. All five LSOAs are in the 2% most deprived in England.
- The most deprived LSOA lies within Mansfield district. It is ranked the 36th most deprived out of the 32,844 LSOAs in England (a relative improvement on 16th in 2015).
- To find out the location of a particular LSOA, we have created a web app. Simply type in a LSOA code into the search box and the map will zoom to its location.
The table and map below shows the LSOAs most affected by Multiple Deprivation
LSOA |
District |
Rank of IMD score (1 most deprived) |
|---|---|---|
E01028276 |
Mansfield |
36 |
E01028263 |
Mansfield |
154 |
E01028256 |
Mansfield |
256 |
E01027974 |
Ashfield |
438 |
E01027951 |
Ashfield |
985 |
How has the index of multiple deprivation been calculated?
The Index of Multiple Deprivation is calculated from the domain results. Some domains carry more weight in the overall score than others. The domains are Income, Employment, Health & Disability, Education, Skills & Training, Barriers to Housing & Services, Crime and Living Environment.
If you are interested in finding out more detail on the Indices of Deprivation, and how these have been calculated, please see the central government guidance from the Department for Communities and Local Government.
Indices of Deprivation by Postcode
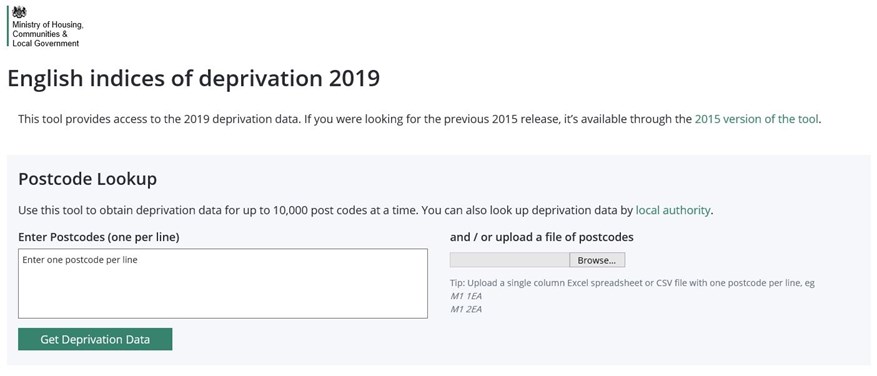
The Ministry of Housing, Communities and Local Government have developed a useful tool which will help you understand the areas in which your customers live and the levels of deprivation in different areas.
- Either enter a postcode or a number of postcodes and the tool will return results for all the Indices of Deprivation for the LSOA in which the postcode falls.
- Or alternatively if you have a set of customer addresses upload these to the tool and the tool will return results for the Indices of Deprivation by LSOA.
- The results can then be exported as either an excel or CSV output. Please explore the tool by clicking on the image below.
What can you use the indices of deprivation 2019 for?
- Comparing different areas. As each super output area has a ranking, different super output areas can directly be compared. A super output area with a ranking closer to 1 will be more deprived.
- Identifying the most deprived areas in England. i.e. Using various cut off points to identify the areas in the most 5%, 10% and 20% in England.
- Looking at differences between the domains of deprivation. Using the domain scores and ranks you can compare which issues are the biggest concerns for different areas.
